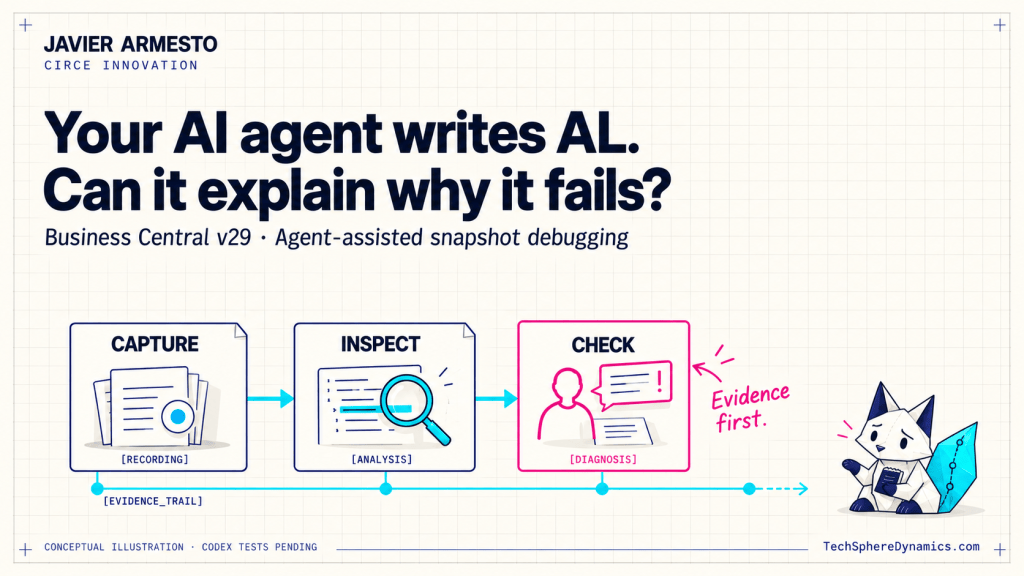
Business Central v29 brings agent-assisted snapshot capture into the debugging workflow. The useful question is how we turn that recording into a diagnosis we can check.
Javier Armesto · Circe Innovation
TechSphere Dynamics · Research checked on 18 October 2026
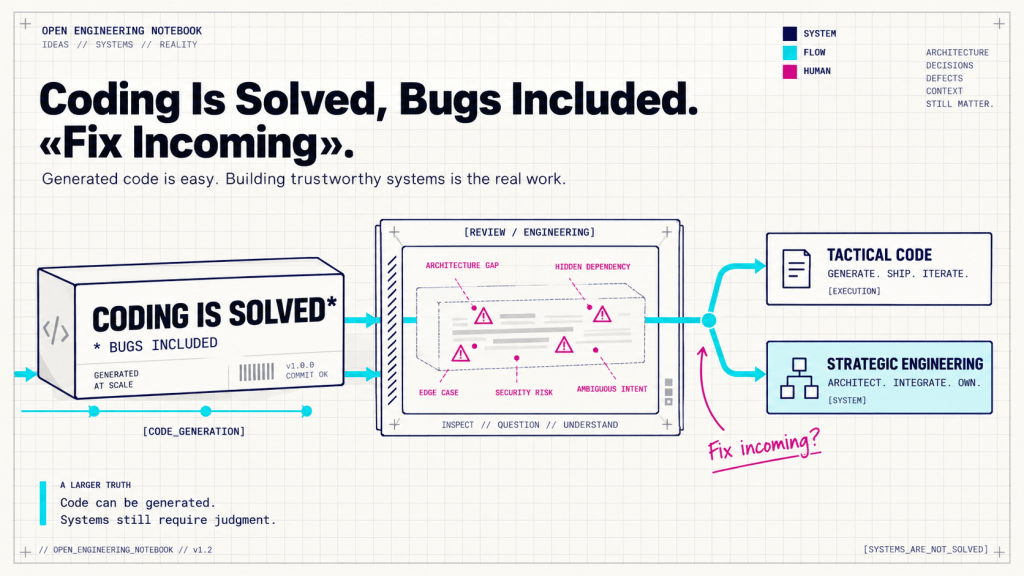
An agent can write an AL procedure, explain its intention and suggest a correction when something goes wrong. But what happens when the explanation sounds reasonable and the application still fails? Have we found the cause, or have we simply found a convincing story?
Microsoft’s “Debug recorded Business Central failures with an AI agent” feature deserves attention because it connects the conversation with recorded execution. That is a practical step towards better investigations. It also gives us a reason to be more precise about what an agent has actually achieved.
Prefer YouTube? Watch the 33-second explainer on Tech Sphere Dynamics. Conceptual illustrations; ALDC/Codex tests are pending.
What changes in v29
The new path lets an agent prepare a snapshot capture, wait while a person reproduces the failing scenario, and collect the recording for investigation. The user still performs the reproduction. This uses the existing snapshot engine rather than replacing it. [1]
Snapshot debugging itself predates v29. The change is the agent-facing route into the workflow. In the editor, AL’s tools already provide snapshot actions; v29 documents an additional connection path through ALTool’s snapshot MCP proxy. [2][3]
My interest is in the connection between code generation and runtime evidence. A repository tells an agent what the code says. A recording can help an investigation examine what happened in a particular execution. Neither removes the need to understand the business rule.
Availability: Microsoft’s pages still disagree
As checked on 18 October 2026, the v29.0 overview lists this feature as generally available. That overview was updated on 1 October 2026. [4]
The snapshot guide, dated 21 August 2026, still describes the agent capability as preview with a prerelease of runtime 18 and Business Central Server 29. The ALTool reference, updated on 1 October 2026, repeats that preview qualification. [1][3]
There is therefore a current documentation inconsistency, not just an old note we can safely ignore. I would describe this as a v29 capability listed as GA in the release overview, with technical documentation still carrying preview requirements. Before planning a customer rollout, check the actual server build, installed development tools and exposed capabilities. I have not verified a minimum production-ready ALTool build for this workflow.
The tools are related, but they are different surfaces
“MCP support” is too broad a description for an implementation decision. These are the boundaries that matter:
| Surface | Documented role | What it does not establish |
|---|---|---|
| VS Code AL Language Model Tools | Editor-integrated actions for AL work, using the active launch configuration. | Availability of the same tools in an external agent host. |
VS Code al_snapshotdebugging | initialize, finish and view
actions, including opening recorded traces in the editor. | An identical tool name or schema in Codex. |
ALTool launchmcpserver | Standalone AL workspace tools, such as build, compile, symbols and diagnostics. | That the workspace server includes the VS Code debugger tools. |
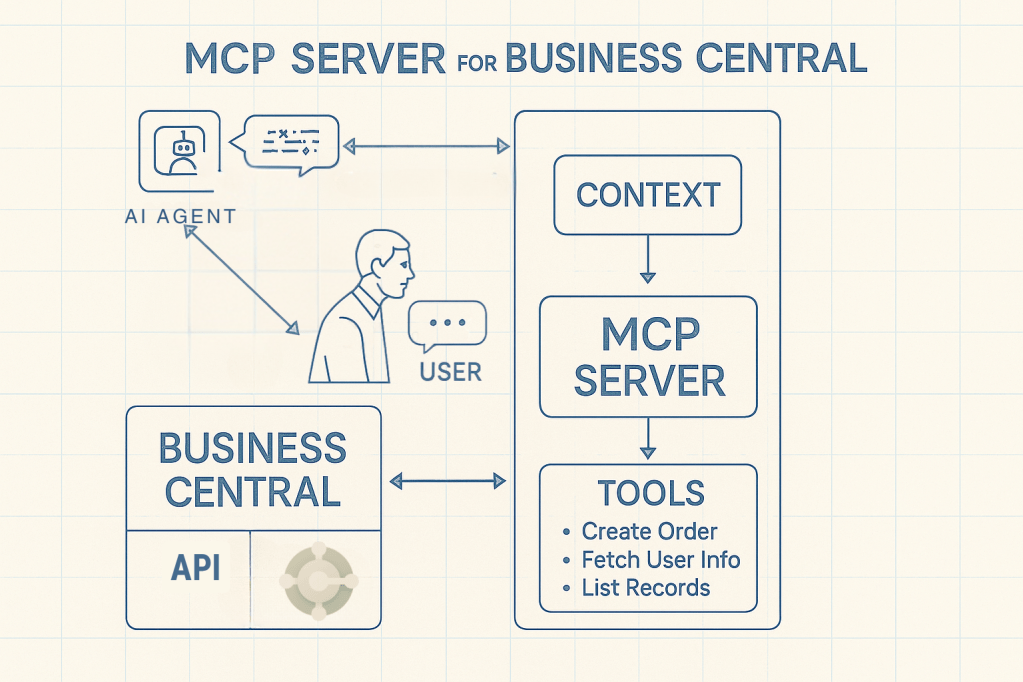
ALTool launchsnapshotmcpproxy | A stdio bridge to snapshot capabilities in a running BC environment; no local AL project is loaded. | That receiving an archive gives Codex a working snapshot inspection interface. |
| Business Central MCP server | The environment-side service that the snapshot guide identifies as hosting the snapshot capabilities. | Interchangeability with the local AL workspace MCP server. |
| Troubleshooting MCP Server for AL | Access to frames, variables and source during a paused VS Code debugging session. | A general offline reader for arbitrary historical recordings. |
Sources: [1][2][3][5][6][7].
Microsoft documents automatic snapshot-proxy registration in VS Code
agent mode, deriving the connection from launch.json.
Outside the editor, the host must launch the proxy and authenticate
correctly. [3] A configuration that works for one host should not be
copied into another host’s configuration format without checking it.
Capture, inspection, diagnosis and validation are separate achievements
I would keep four explicit milestones in any investigation:
Capture: there is a recording of the intended reproduction. A successful tool call alone is not enough to establish that the relevant failure was recorded.
Inspection: the investigator can access useful execution state and relate it to the correct application version. Possessing a binary archive is not the same as reading its contents.
Diagnosis: the proposed cause explains the observed state and the business behaviour. The explanation should identify supporting evidence, competing explanations and information that is missing.
Validation: a targeted test fails before a correction and passes after it, and relevant regression checks support the change. A diagnosis can be correct while a proposed correction is incomplete.
These are acceptance criteria I propose for our engineering workflow. They are not results from a completed Codex experiment.
What to check before trusting the explanation
The recording has limits. Variables are captured at snappoints and AL
exceptions, rather than continuously. Matching symbols and deployed code
matter. The MCP path also requires an enabled environment MCP server,
D365 Snapshot Debug and D365 ATTACH DEBUG,
including for the caller’s own session. [1]
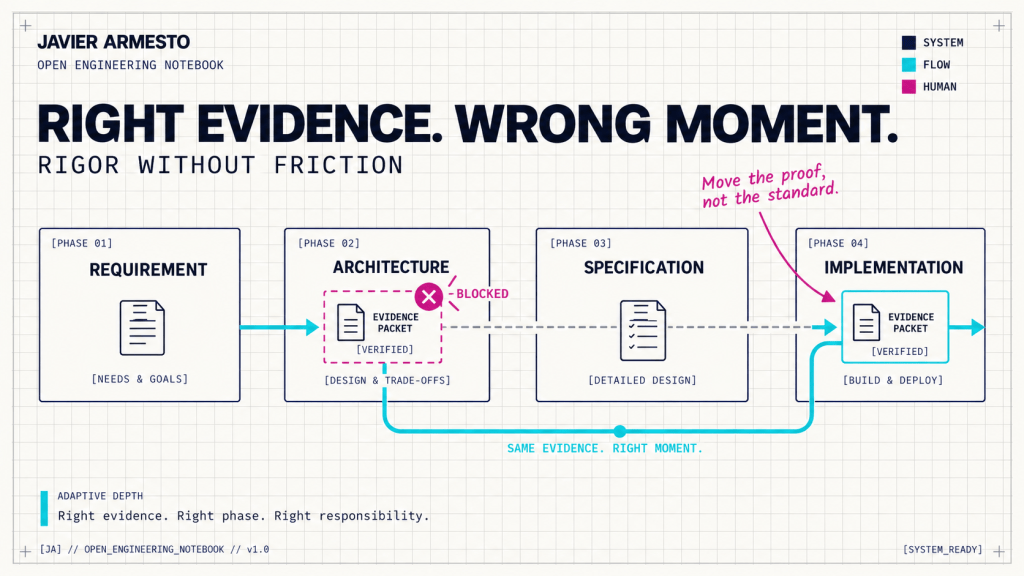
That changes how I would review an agent’s report. For each claim, I want the recorded value or execution point that supports it. If the needed state was not captured, the report should say so and propose another observation. An empty result must not become evidence that nothing happened.
The separate Troubleshooting MCP documentation is also useful here: it describes a paused active debugger, limits analysis to its current stack, and explicitly calls for verifying variables, frame order and source versions. [7] We should not silently promote that into proof that an external host can inspect every collected snapshot.
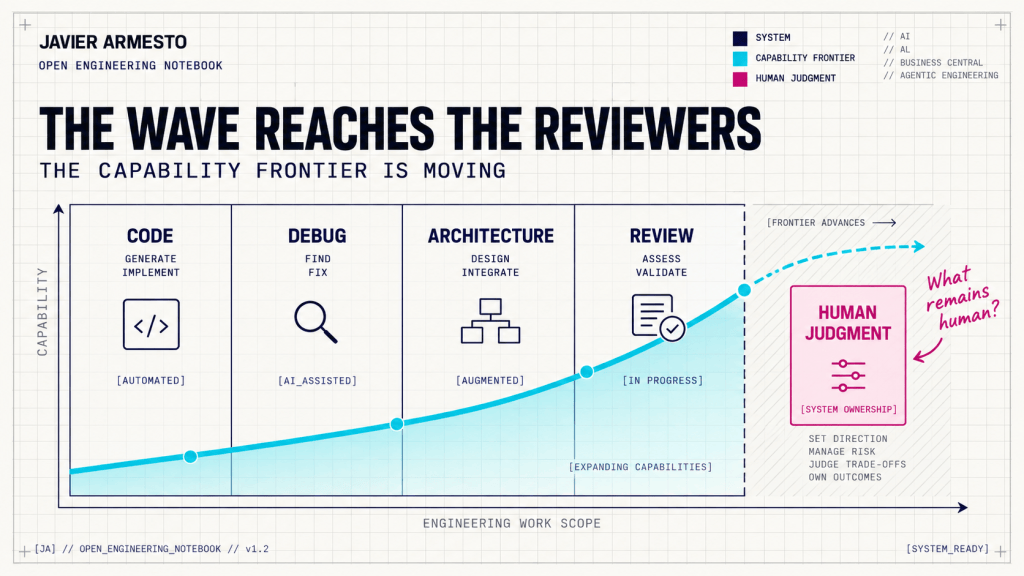
For partners, the practical implication is ownership. Who selects the scenario? Who confirms that the capture is relevant? Who checks the explanation against the requirement? Those responsibilities should remain visible even when an agent performs more of the tool work.
Where ALDC could fit
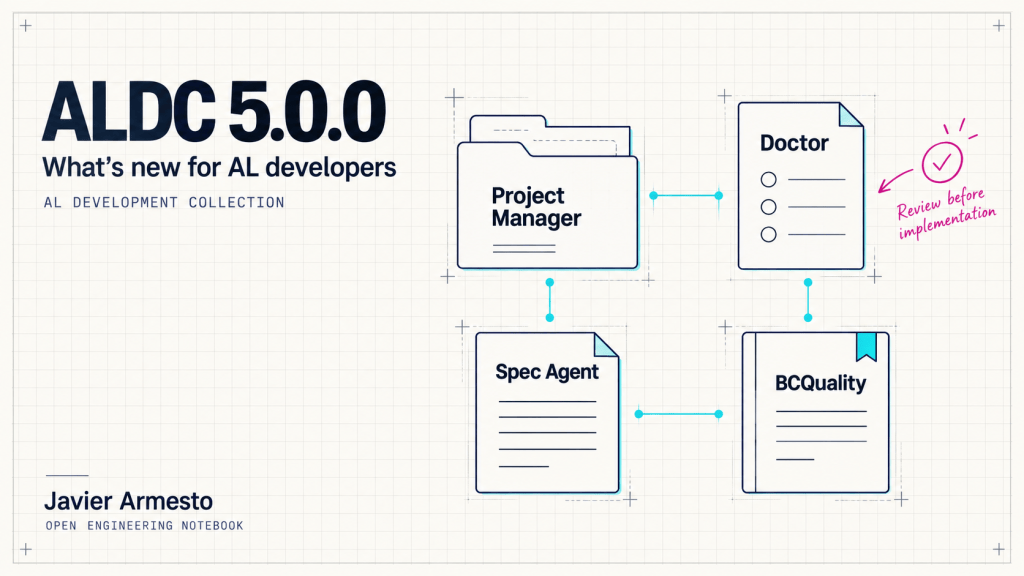
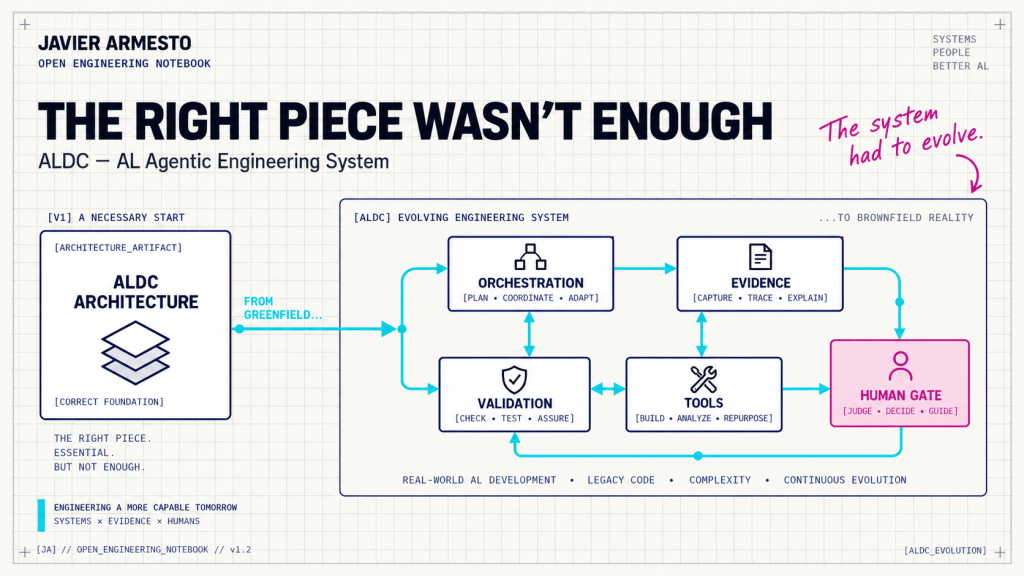
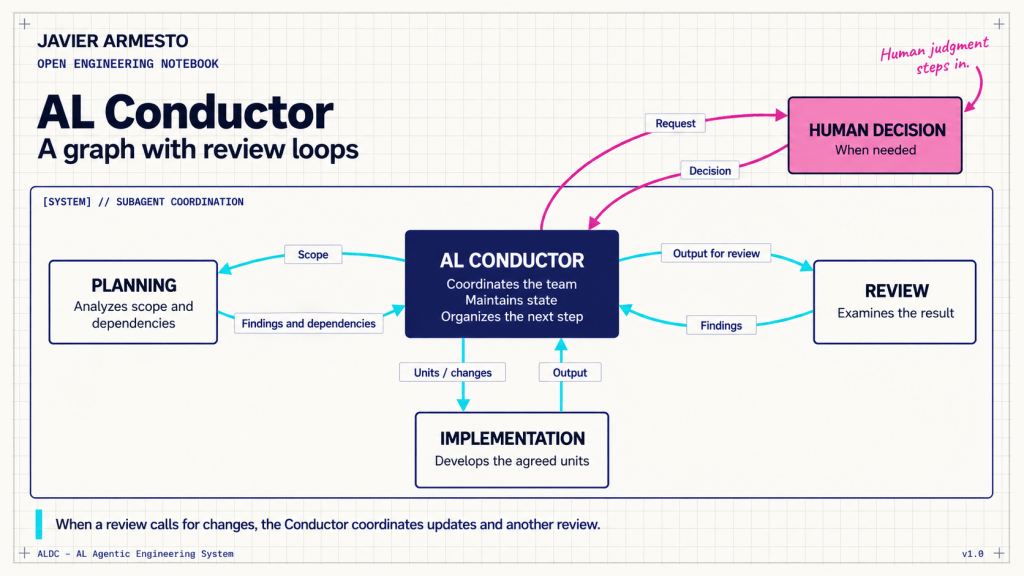
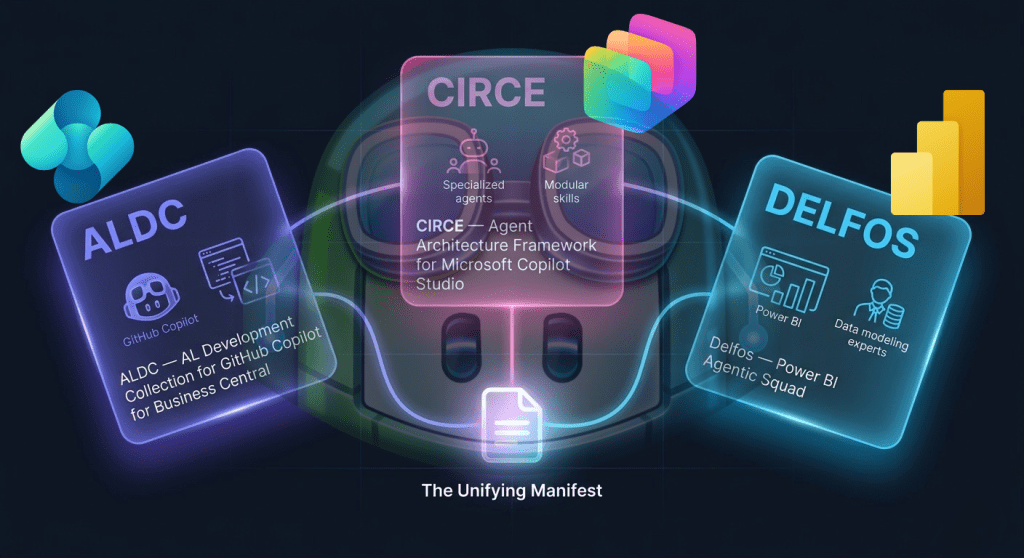
For ALDC — AL Agentic Engineering System, I see a possible investigation workflow: preserve the failure description and version baseline, collect a controlled recording, require an evidence-backed diagnosis, then carry a proposed correction into review and testing.
The important connection is between artifacts. A diagnosis should point to evidence. A proposed change should point to the diagnosis. A test should demonstrate the behaviour we intend to restore. A reviewer should be able to follow those links without having to trust the agent’s confidence.
This is a proposed application of ALDC. My tests of this v29 workflow with ALDC in Codex are pending. I am not claiming that Codex can already collect, inspect, diagnose and validate a correction through this combination.
The experiment I want to run next
Start with a reproducible failure in an isolated sandbox and record the tool and server versions. First test discovery and capture. Then establish whether Codex can inspect the recording through an available, supported surface. If it cannot, record that boundary and use VS Code for human inspection.
Only after that should we assess the diagnosis. Include a case with insufficient evidence, because admitting uncertainty is part of the behaviour we need to test. Keep correction and regression validation as a later, separately measured stage.
The feature is worth exploring because it can bring runtime evidence closer to an agent’s investigation. My acceptance criterion remains simple: can another developer check the explanation against what was captured?
Evidence first. Human judgment, always.
Official sources
All sources accessed on 18 October 2026. These are documentation findings, not local execution results.






















Deja una respuesta